

Key Takeaways on Analytics for Rural Health Clinics
- Use real-time dashboards to track visit volume, payer mix, and reimbursement trends so you spot issues early and protect clinic revenue.
- Monitor quality and performance metrics to meet CMS reporting requirements and support value-based care participation with confidence.
- Analyze patient access and utilization data to identify care gaps, reduce no-shows, and improve scheduling efficiency.
- Rely on integrated EHR and billing analytics to replace manual reporting, reduce errors, and make faster, data-driven decisions.
Good analytics for rural health clinics can help with regulatory compliance and provide key insights that improve performance and revenue.
And the Azalea Analytics platform has key features that help RHCs stay compliant and increase revenue:
- Turnkey and automated cost reporting: Azalea’s built-in analytics platform provides detailed and auditable cost reporting by provider that shows all RHC qualified visits, complete with the correct CPT codes filtered and listed accordingly.
- Ad hoc reporting: Azalea’s ad hoc reporting tools let RHCs address core cost and census reporting requirements with just a few details. Reports are accessible online as an easily shareable pivot table that can be drilled down by location, provider, mid-levels vs physicians, CPT codes, payers and patient demographics, and more.
- Performance management dashboards and reports: Azalea’s advanced reporting environment lets RHCs set goals and benchmarks for every physician, location, or even payer. RHCs can visually track more than 100 key performance indicators including; patient volume and productivity metrics, such as RHC qualifying visit count, new patient count, unique patients, and RVUs. RHCs can match those metrics with reporting on financials, collections, AR, and denials KPIs for a full view of practice performance.
Five Analytics Reports Every RHC Needs
The livelihood of an RHC depends on visit counts, which must be measured accurately. And certain rural health grants can only be given with collected population health metrics.
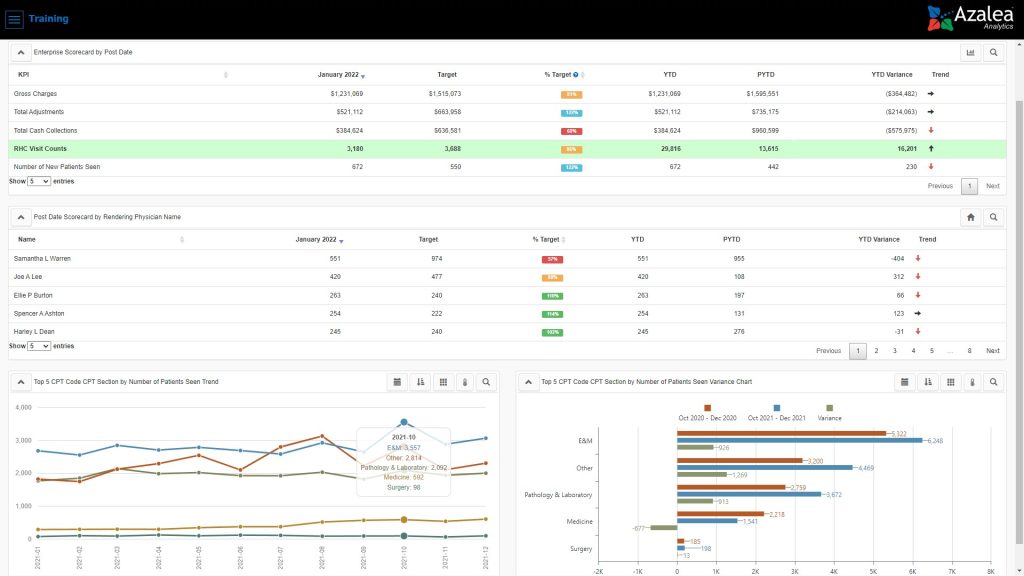
1. Interactive Executive Scorecard Dashboard Looking at RHC Qualified Visits by Provider
As a decision maker, your time is valuable. And the interactive executive scorecard dashboard in Azalea Analytics lets you quickly understand trends in performance, qualified RHC visit counts, physician performance to goal, and more . There’s no need to run 30 reports in order to understand the performance of your practice or providers. You get it all on one clear dashboard.
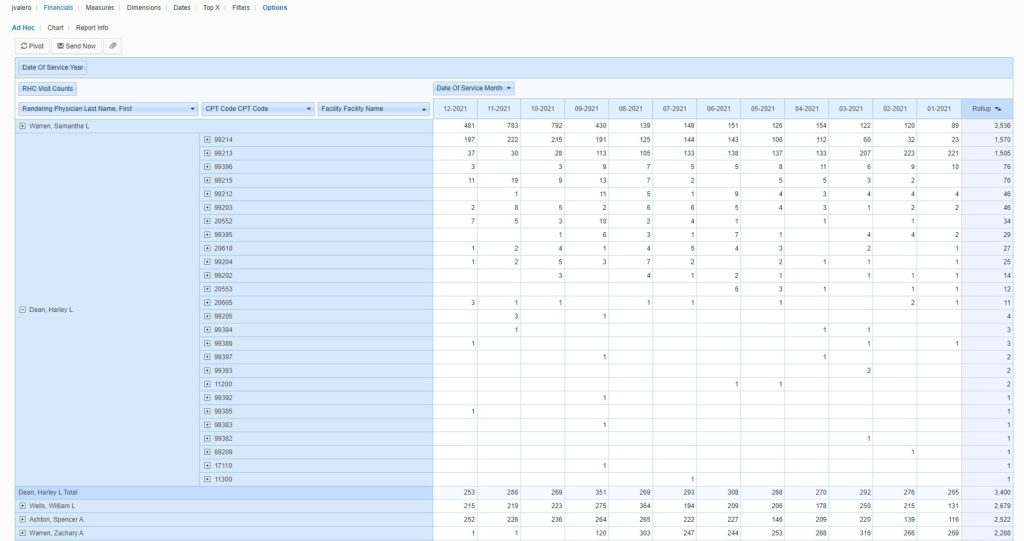
2. Ad Hoc Analysis Tool Showing RHC Qualified Visits by Provider and CPT Code
The ad hoc analysis tool lets you easily understand visit types by provider over time, so you can see and predict care trends. You see what physicians are spending time on and where there is room for improvement with pivots customizable to your practice. Ad hoc reports help address your cost reporting requirements and provide a saved, auditable reference for all provider RHC qualified visits.
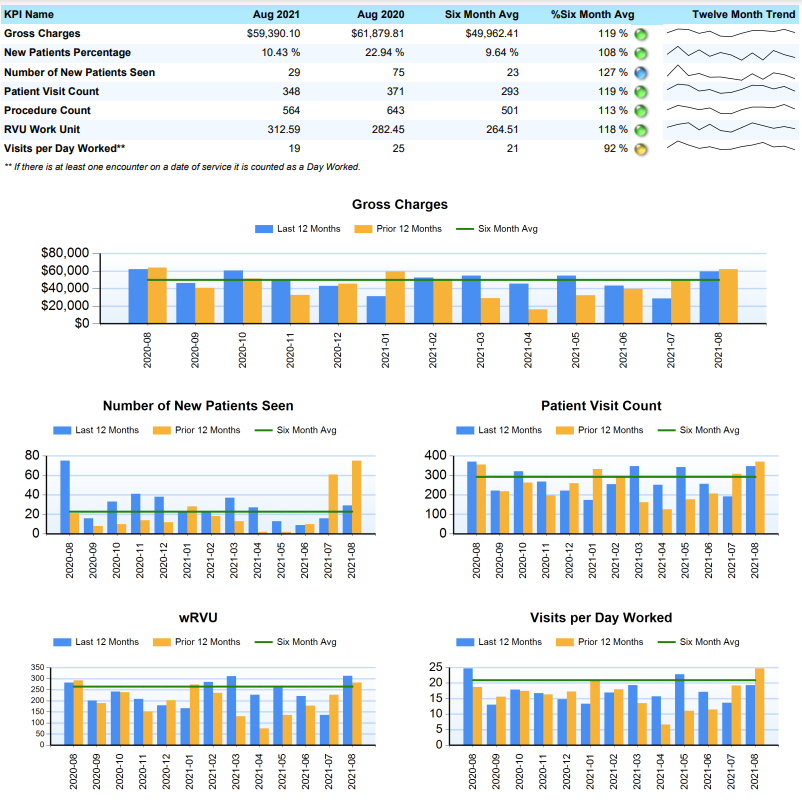
3. One-Page Monthly Provider Productivity Dashboard Report
The monthly provider productivity dashboard report lets you understand and effectively communicate individual provider productivity by comparing KPIs, such as gross charges, patient visit count, and procedures performed compared to monthly averages for a true view of performance over time.
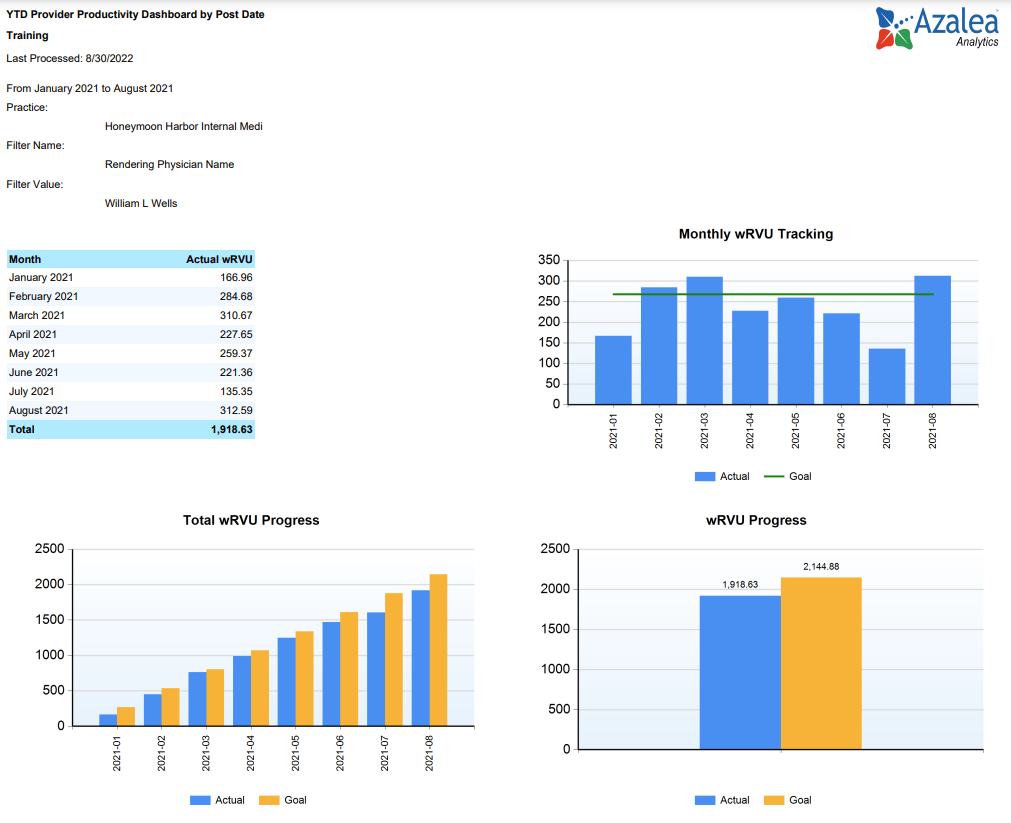
4. Year-to-Date Provider RVU Analysis
The provider RVU analysis lets you track RVU progress by provider in easily translatable graphs and charts. The report is can be filtered by post dates and physician name to see individual CPT codes and wRVUs assigned. It can be downloaded or sent with a click of a button.
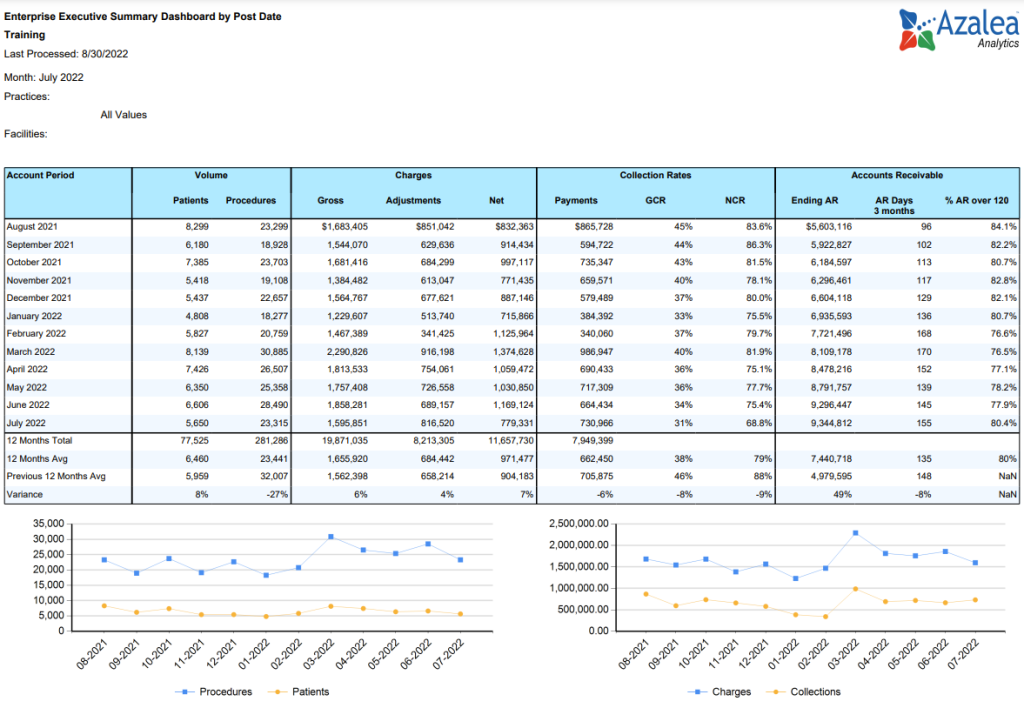
5. Executive Summary Dashboard
Your time is valuable, you don’t want to spend it running repetitive reports. And you won’t when you use the executive summary dashboard to measure patient volume, so you can find ways to increase it, charges, collection rates and AR in an easily accessible and always updated dashboard. Customize to your needs and schedule automated reports that answer questions before they are asked.
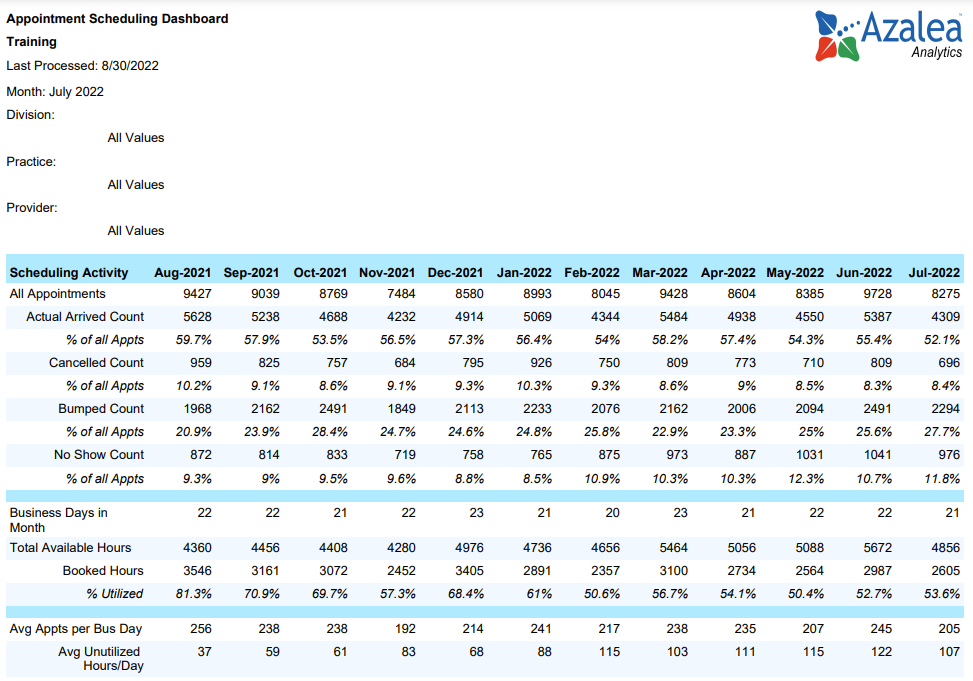
Bonus Report! Appointment Scheduling
The appointment scheduling dashboard lets you break down and compare appointment arrivals, cancellations, and no-shows to understand where you can increase efficiency. Graphs showing fulfilled vs unfilled appointments highlight areas that can be improved. And the utilization analysis is helpful for managing resources and optimizing scheduling.
Find Out More About Analytics for RHCs
Speak with a rural health expert to learn how to use Azalea Analytics to your clinic grow.